The independent resource on global security
10. International arms transfers and arms production
Contents
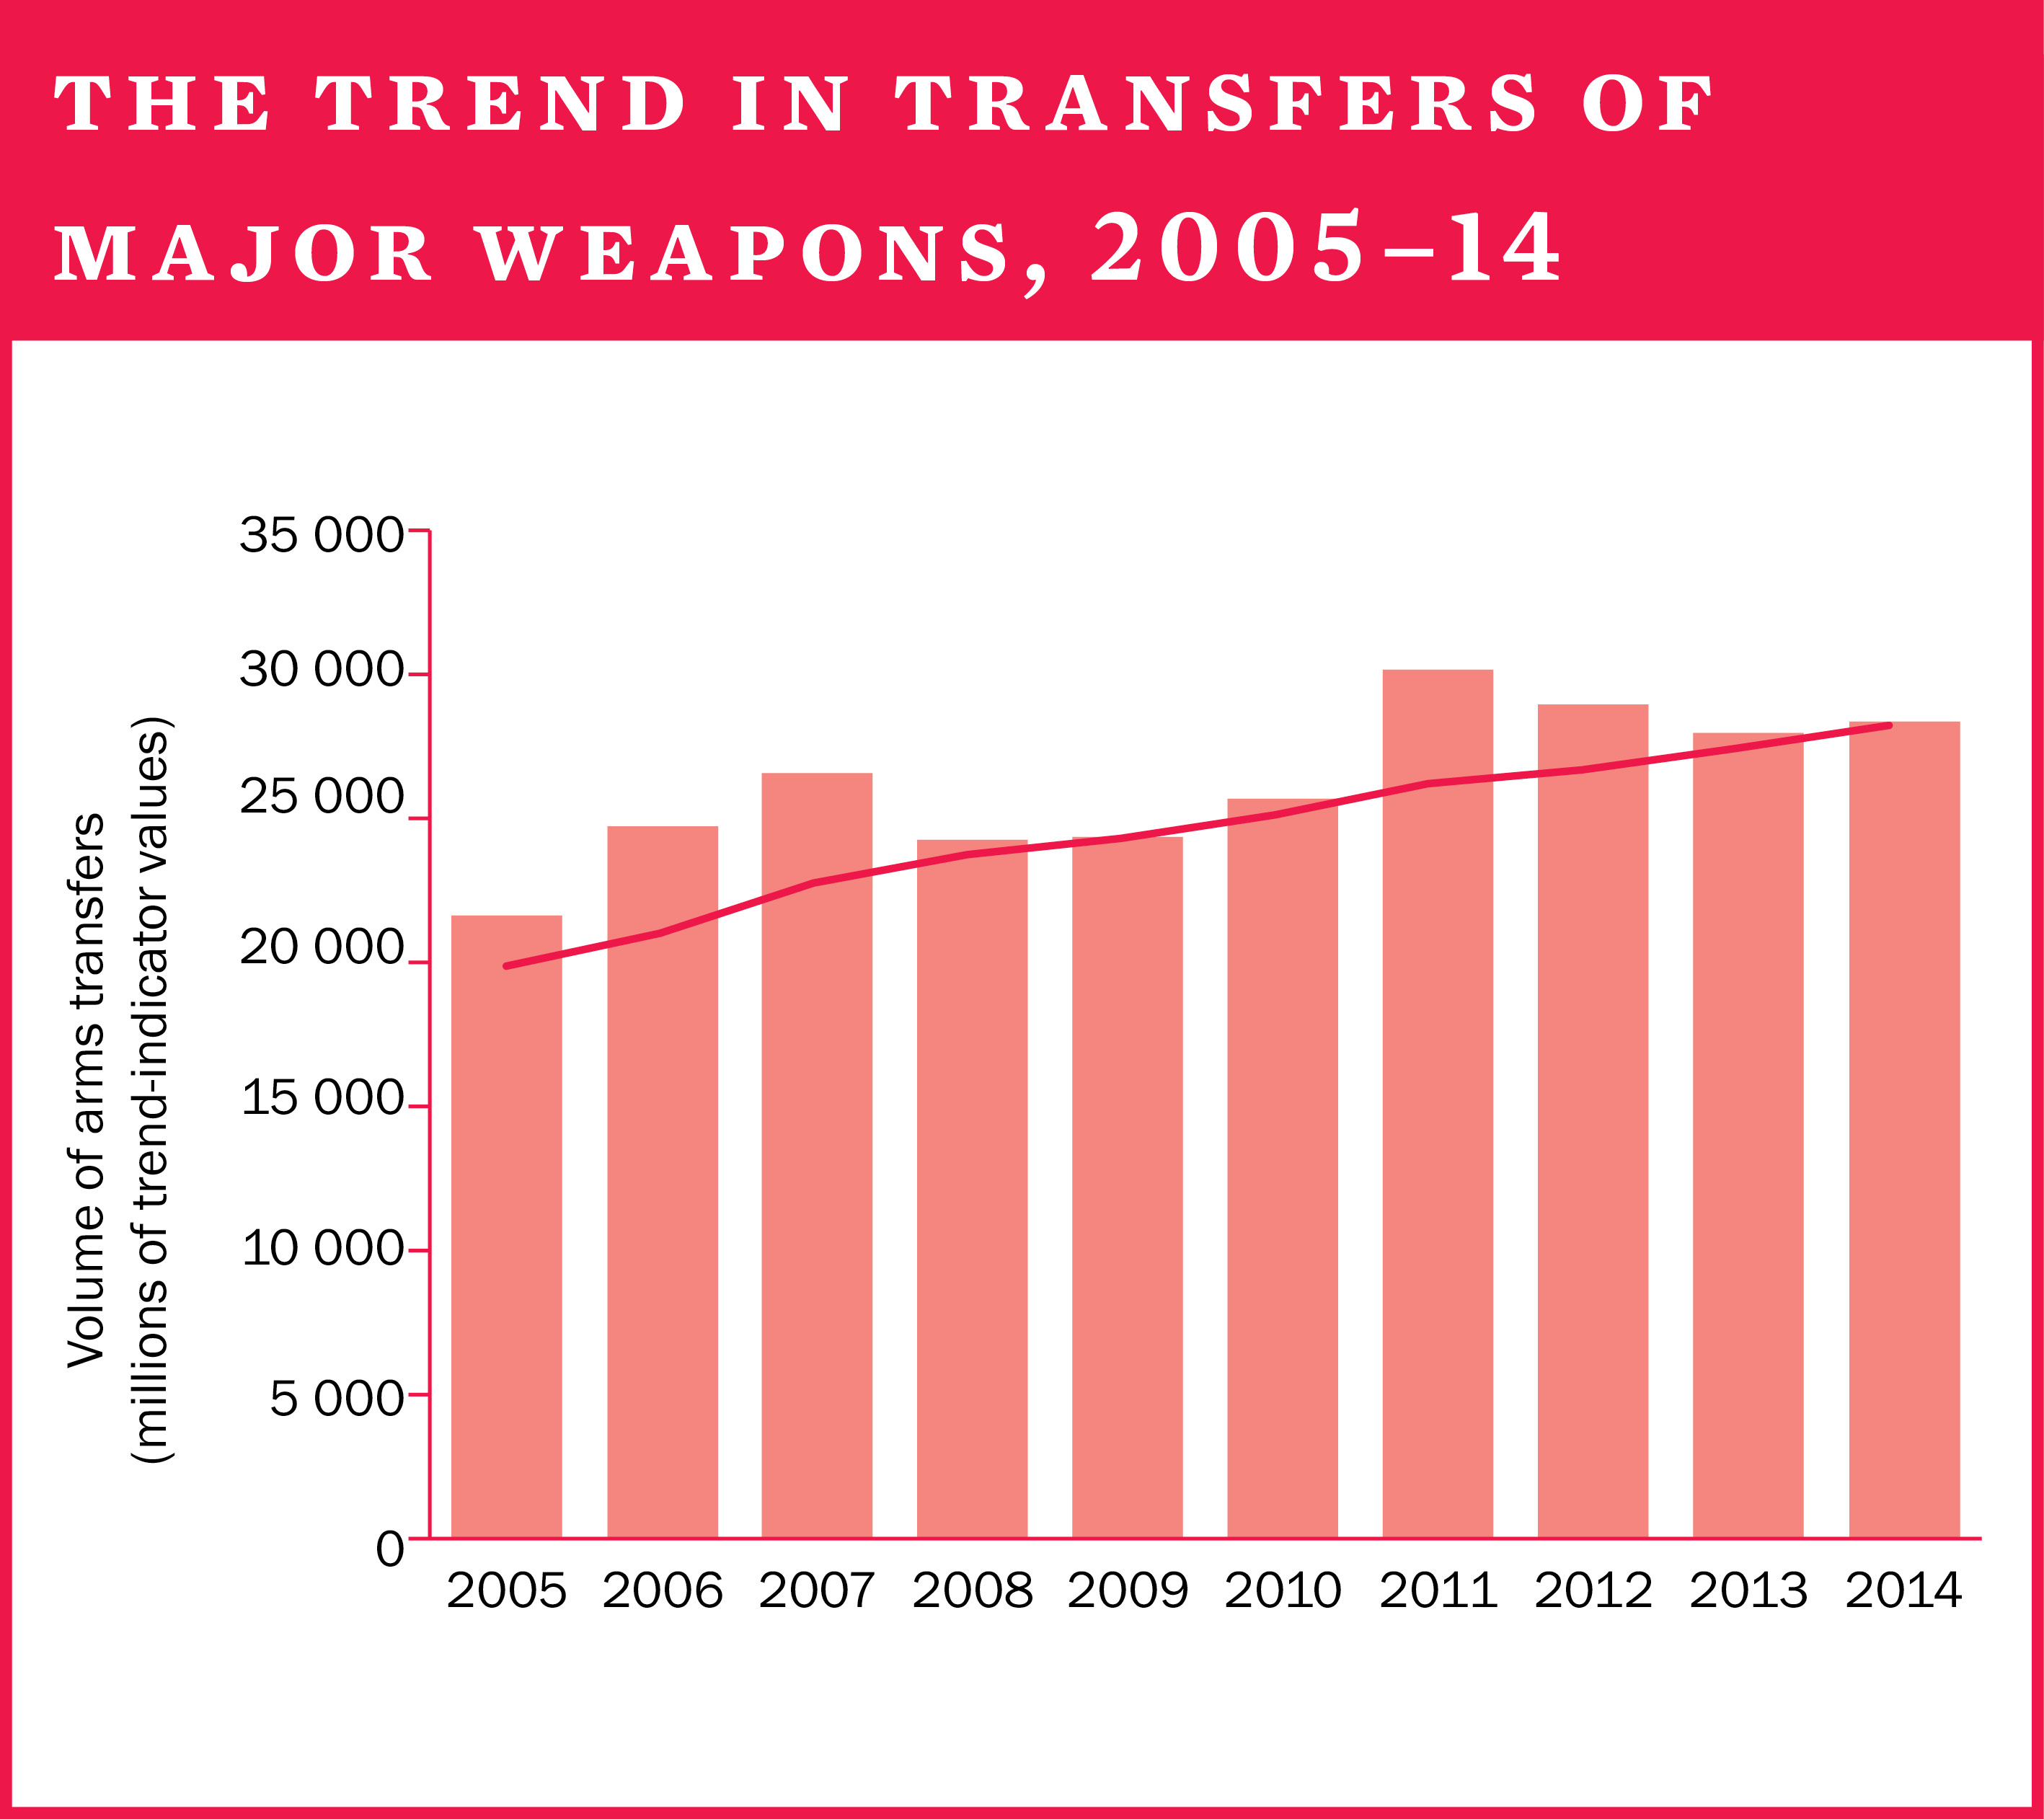
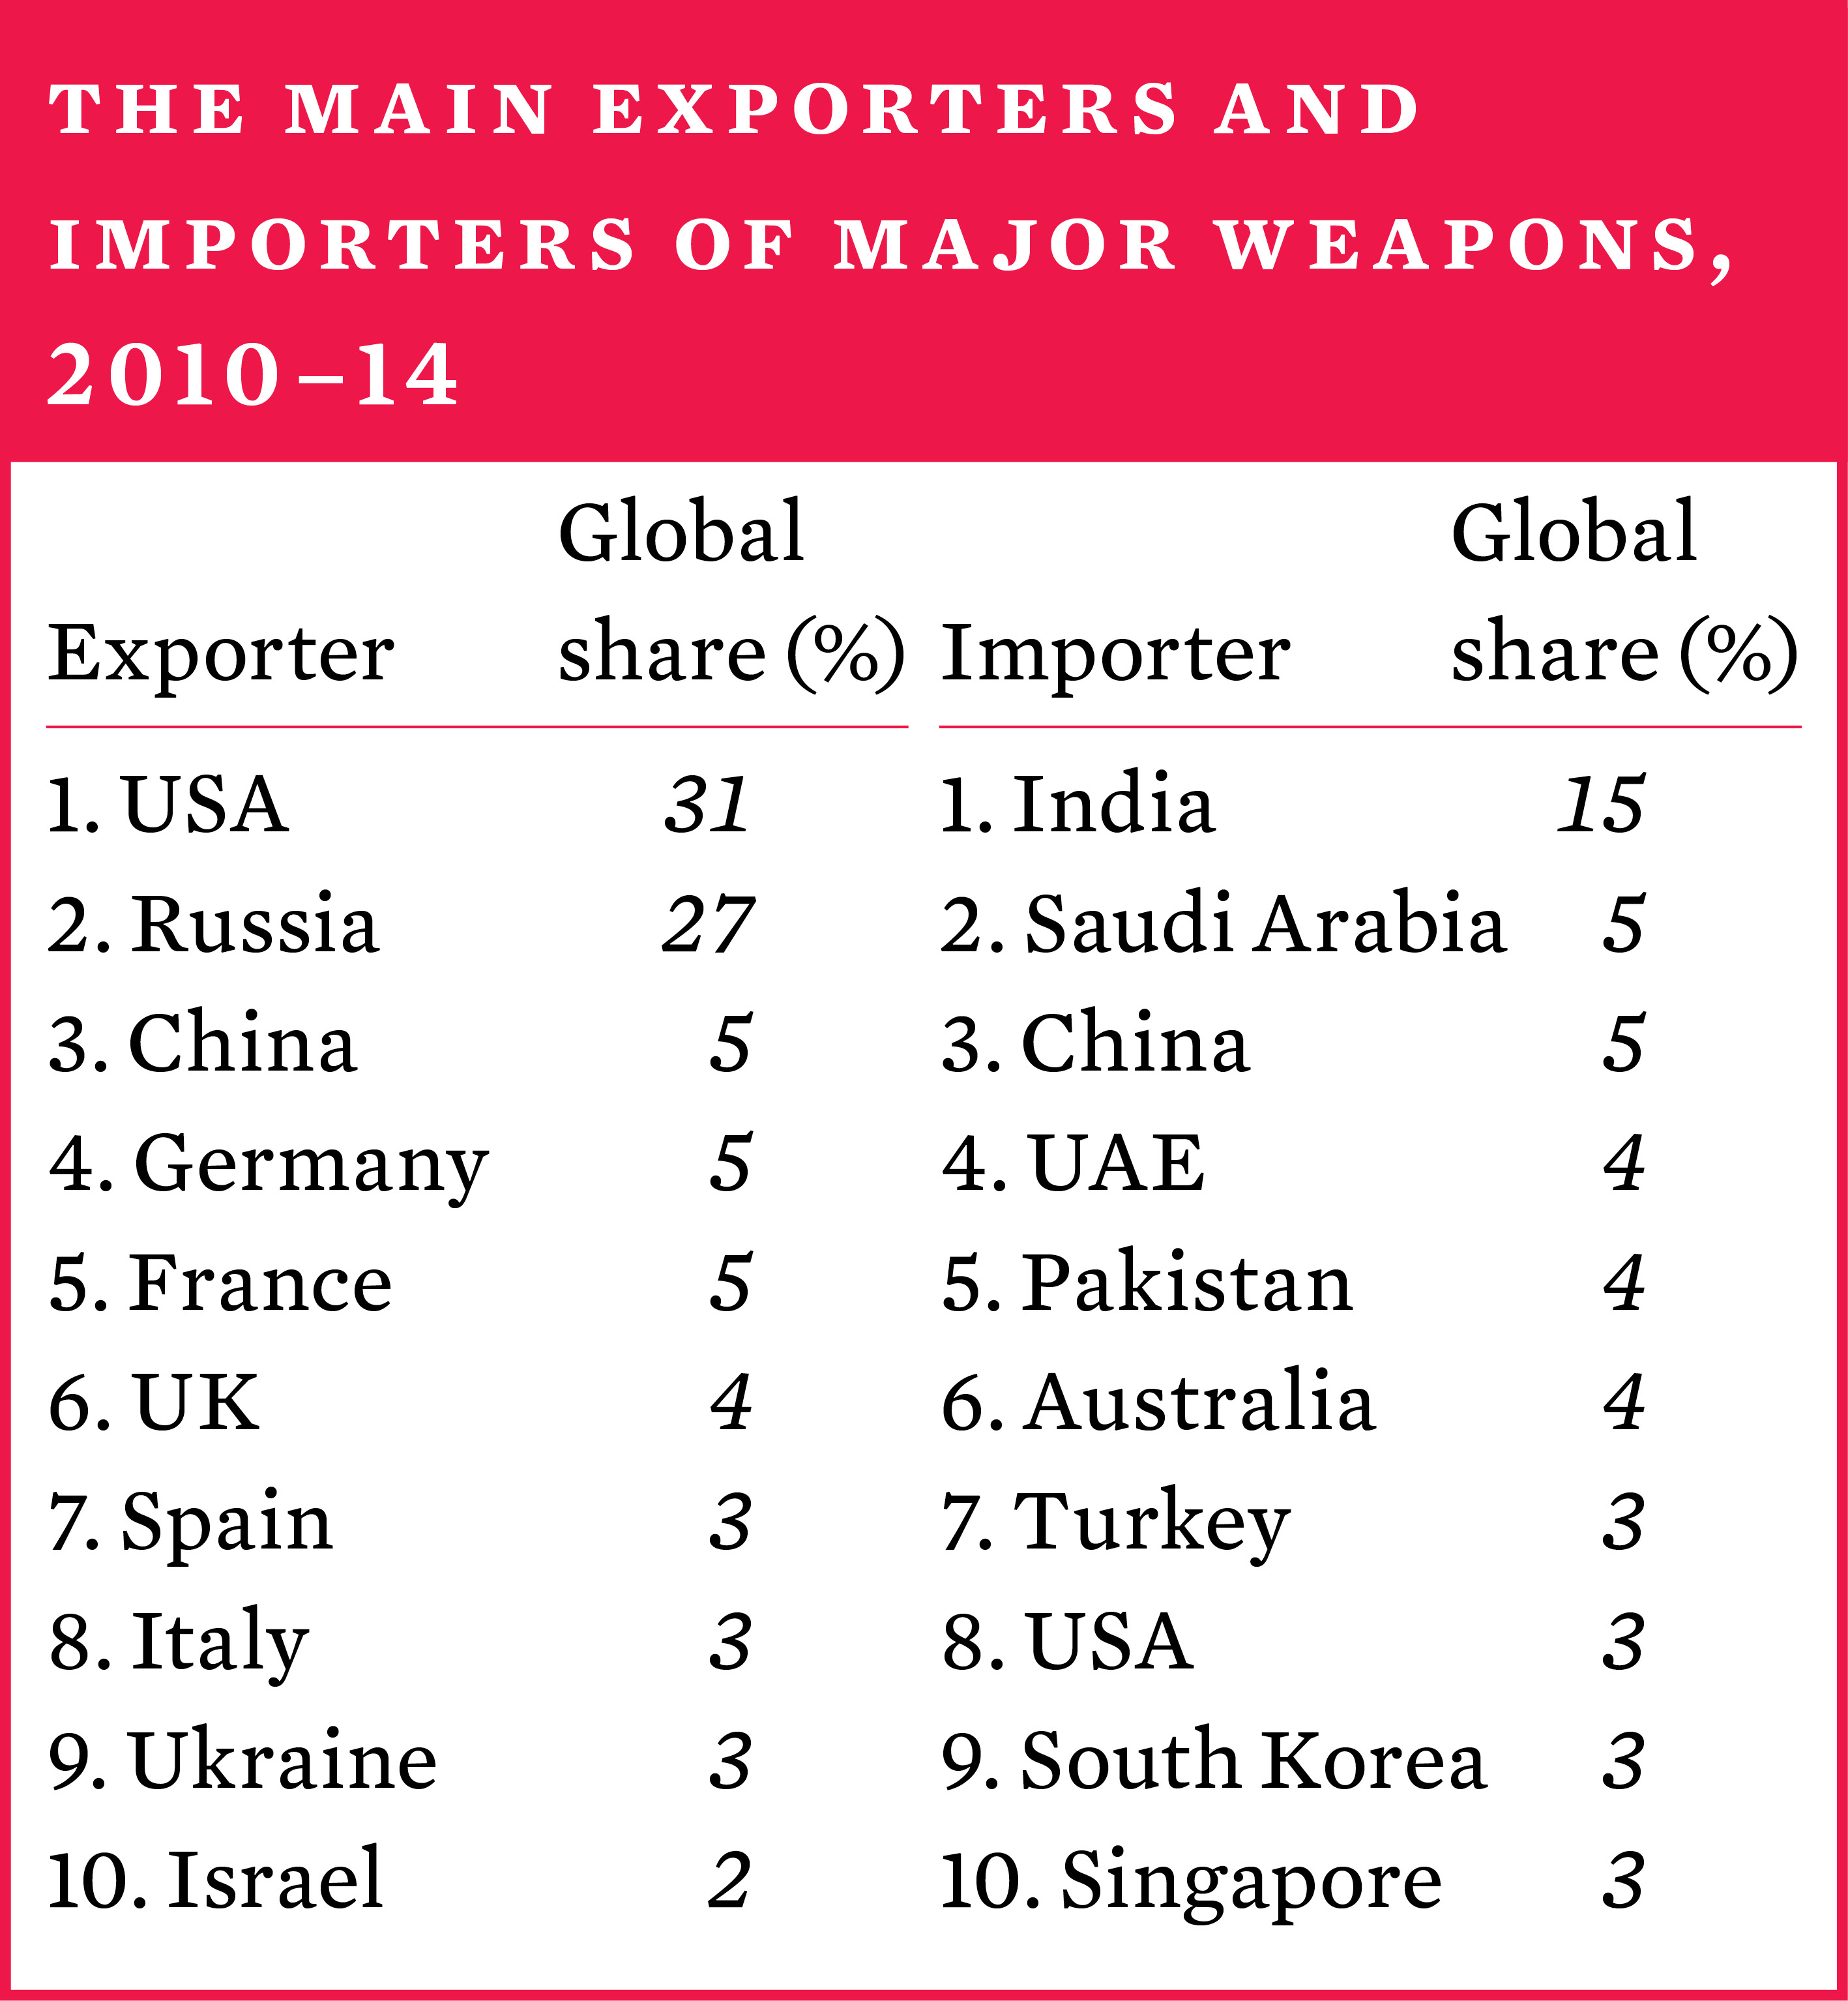
The volume of international transfers of major weapons grew by 16 per cent between 2005–2009 and 2010–14. The five largest suppliers in 2010–14—the United States, Russia, China, Germany and France—accounted for 74 per cent of the total global volume of arms exports. Since 1950 the USA and Russia (or the Soviet Union before 1992) have consistently been by far the largest suppliers. They, together with Western European suppliers, have historically dominated the top 10 list of suppliers, and there are no signs there will be any major changes in the near future. However, China has now firmly established itself as one of the top 5 suppliers: in 2010–14 it was the third largest supplier, narrowly surpassing Germany and France.
Developments in arms transfers, 2014
The flow of arms to Africa and Asia increased in 2010–14 when compared to 2005–2009. Flows to Europe decreased notably. States in Asia and Oceania received 48 per cent of all imports of major weapons in 2010–14. Of the five largest recipients of major weapons, three were located in Asia and Oceania: India, China and Pakistan. There was also a marked increase in imports by states in the Middle East, two of which were among the five largest importers in 2010–14: Saudi Arabia and the United Arab Emirates. The significant growth in Saudi Arabia’s imports and its rise to the position of second largest importer in 2010–14 was especially noteworthy. Saudi Arabia and several other Arab states of the Gulf have placed substantial orders in recent years. Deliveries of those orders have only just started and thus further growth in the region’s imports is expected.
Tension and conflict were ongoing in large parts of the world during 2014, and these often had direct links to arms acquisitions from abroad. Arms imports by North East Asian countries, for example, are linked to various tensions in that region. These imports, along with acquisitions from growing national arms industries in the region, may well serve to increase such tensions.
Arguably the most important event in 2014 related to arms transfers was the entry into force of the Arms Trade Treaty in December 2014.
Transparency in arms transfers
Following the trend set in 2012 and 2013, 2014 proved to be another disappointing year for transparency in arms transfers. The number of states reporting their arms imports and exports to the United Nations Register of Conventional Arms (UNROCA) decreased in 2014. Only just over a quarter of all UN members answered the Secretary-General’s request to report basic data on imports and exports. In the period 2009–13 several of the top 10 suppliers of major arms, as recorded by SIPRI, have not reported to UNROCA every year and a number of the largest importers have been absent for all five years.* Participation from some regions has been consistently low in recent years, particularly from Africa and the Middle East.
Arms transfers to conflict zones and non-state actors
Arms supplies to countries involved in armed conflict and to non-state forces became a key issue in 2014. Suppliers had to make decisions on transfers to Iraq and other states involved in the war against the Islamic State, including supplies to militias not fully under the control of the central Iraqi Government. The conflict in Ukraine also led to discussions among Western countries on the issues surrounding the supply of arms to the Ukrainian Government.
The financial value of states’ arms exports, 2013*
While SIPRI data on arms transfers does not represent their financial value, many arms exporting states do publish figures on the financial value of their arms exports. Based on such data, SIPRI estimates the total value of the global arms trade in 2013 to be at least $76 billion. However, the true figure is likely to be higher.
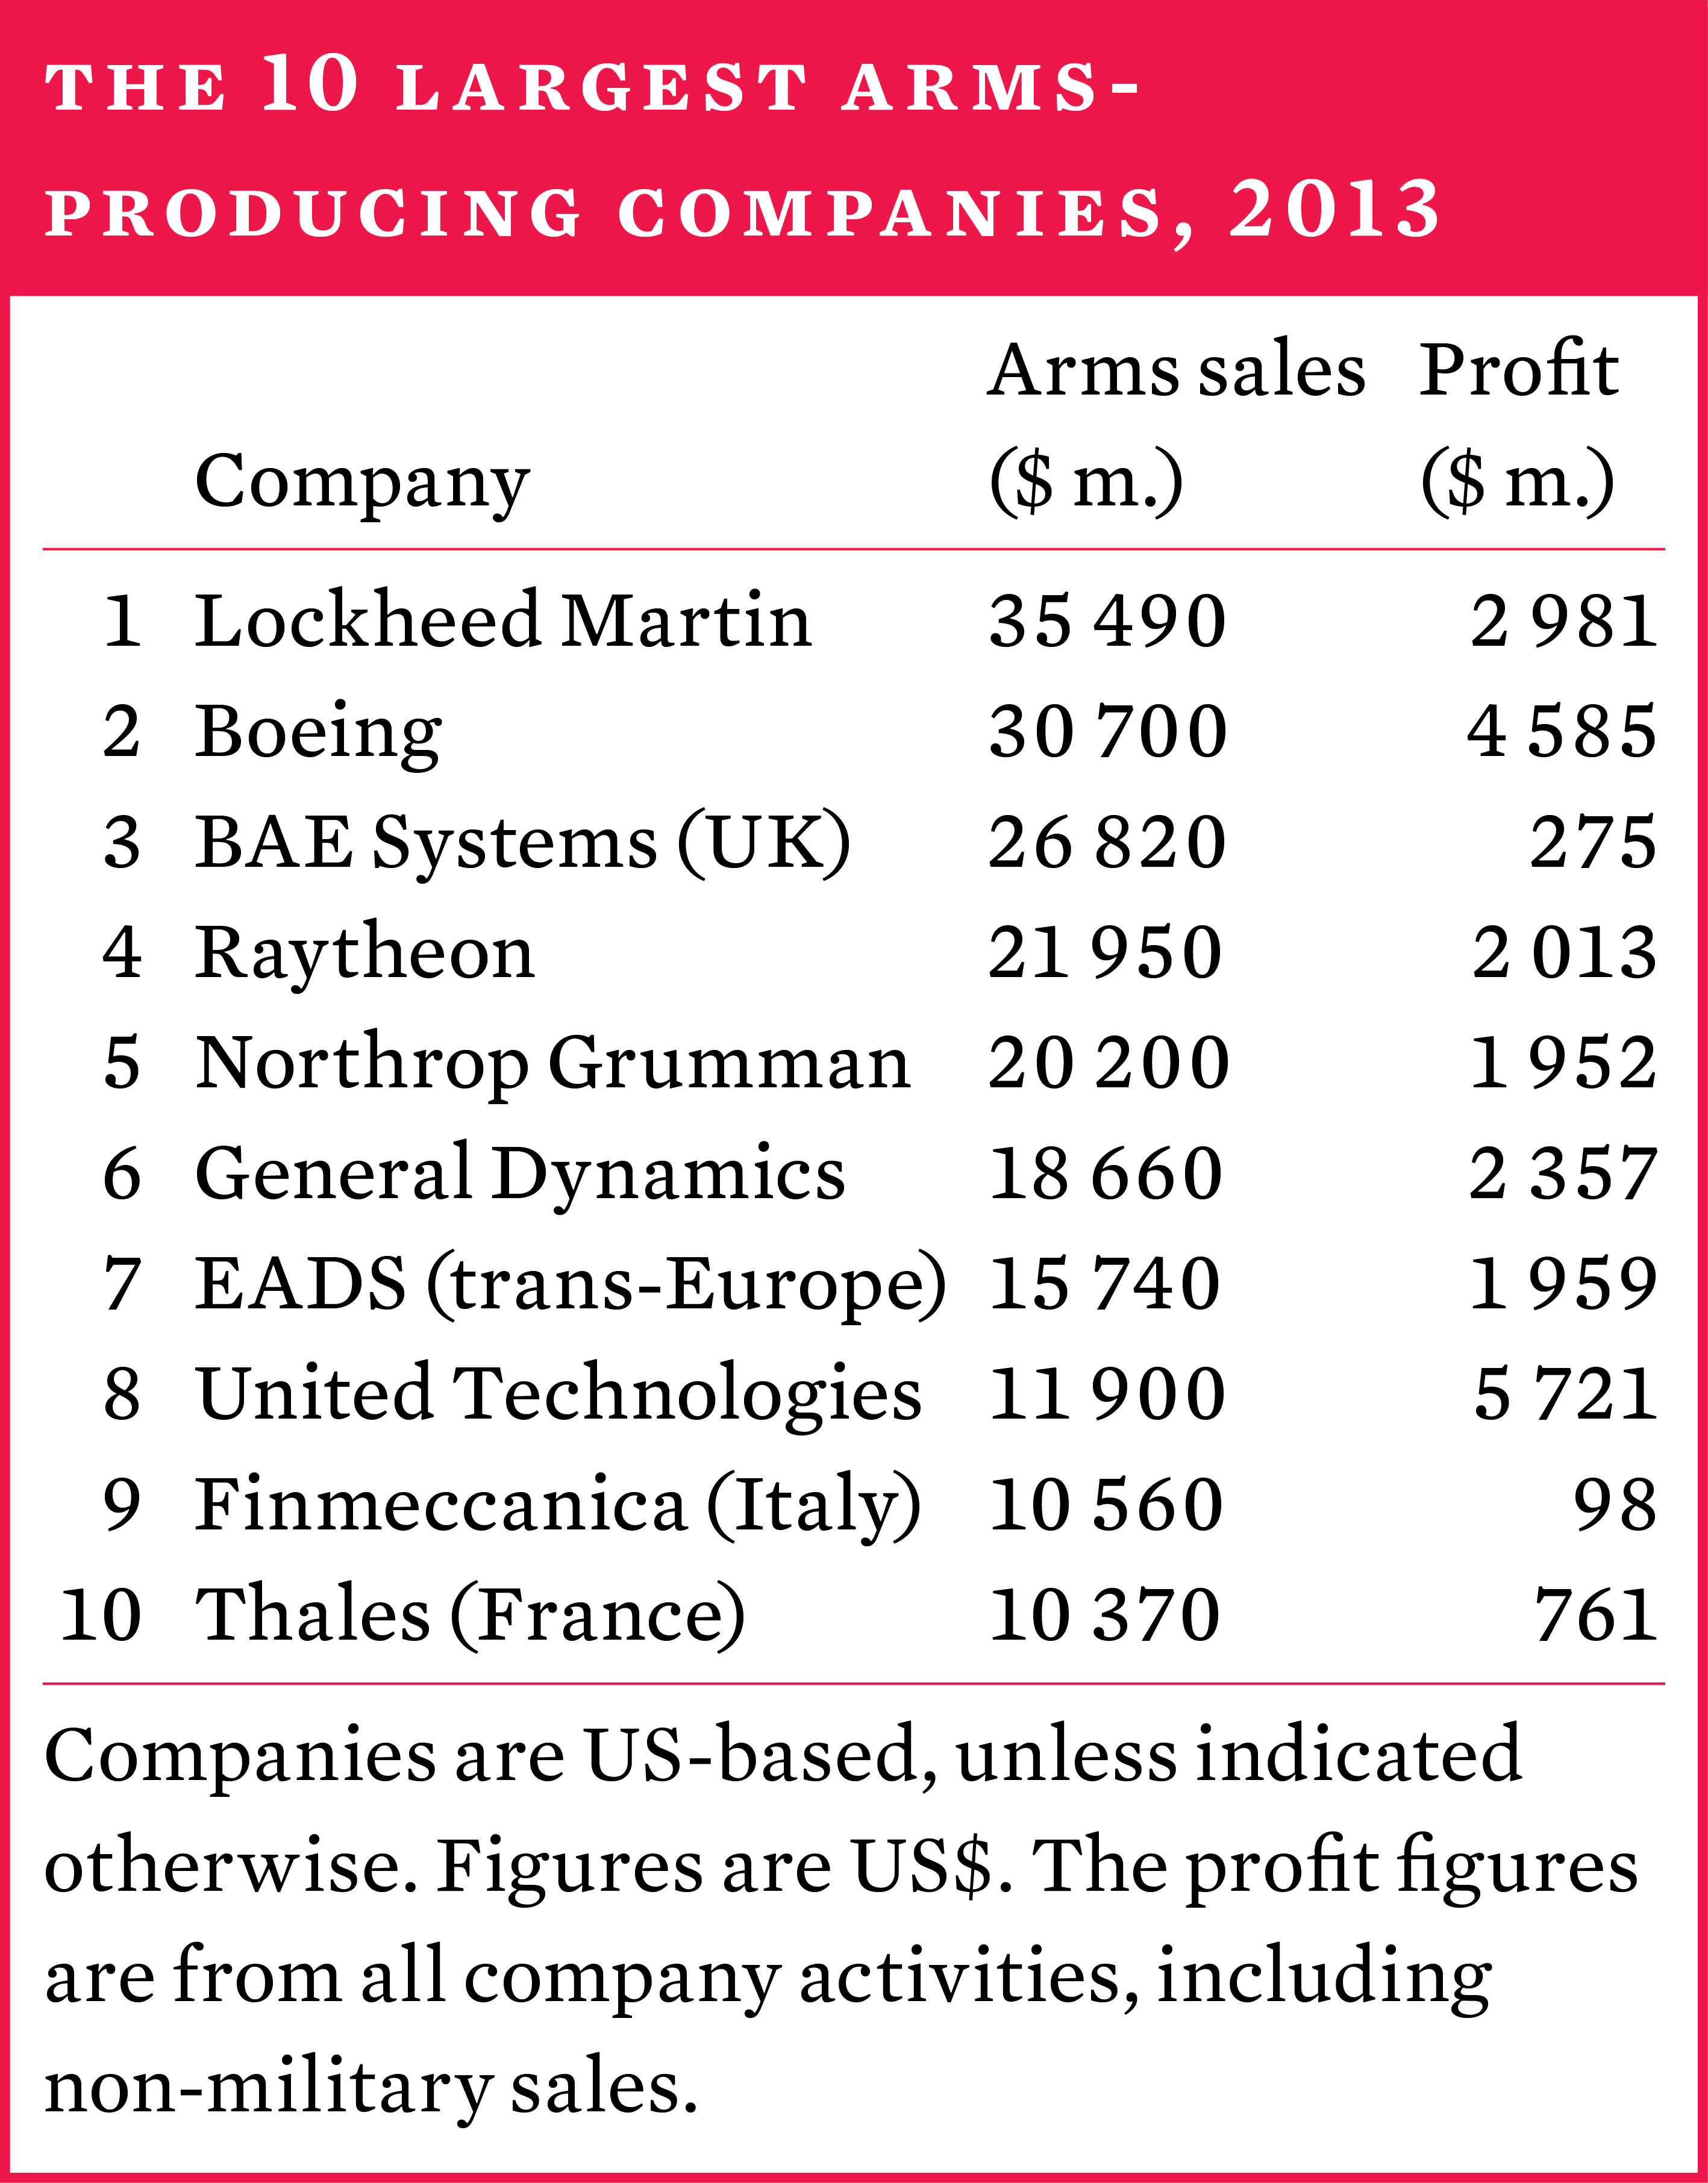
Arms production and military services, 2013*
The sales of arms and military services by the SIPRI Top 100—the world’s 100 largest arms-producing and military services companies (excluding China), ranked by their arms sales—totalled $402 billion in 2013. This is a decrease of 2 per cent in real terms compared to Top 100 revenues in 2012, continuing the decline that started in 2011, but at a slower rate.
* The latest year for which data is available.
English