These graphics visualize data from the 2022 update of SIPRI’s Arms Industry Database, including the SIPRI Top 100 ranking of arms producers and military services companies in 2021.
Read more in the SIPRI Fact Sheet The SIPRI Top 100 Arms-producing and Military Services Companies, 2021.
Access the database and learn more about the sources and methods behind the data here.
The visualization below lets you access data about individual companies in the SIPRI Top 100. You can size the bars to reflect either the value of each company's arms sales in 2021 or how much their arms sales grew or declined between 2020 and 2021. You can also use the filters to isolate companies based in a specific world region. Click on the image to access the full-size, interactive version.
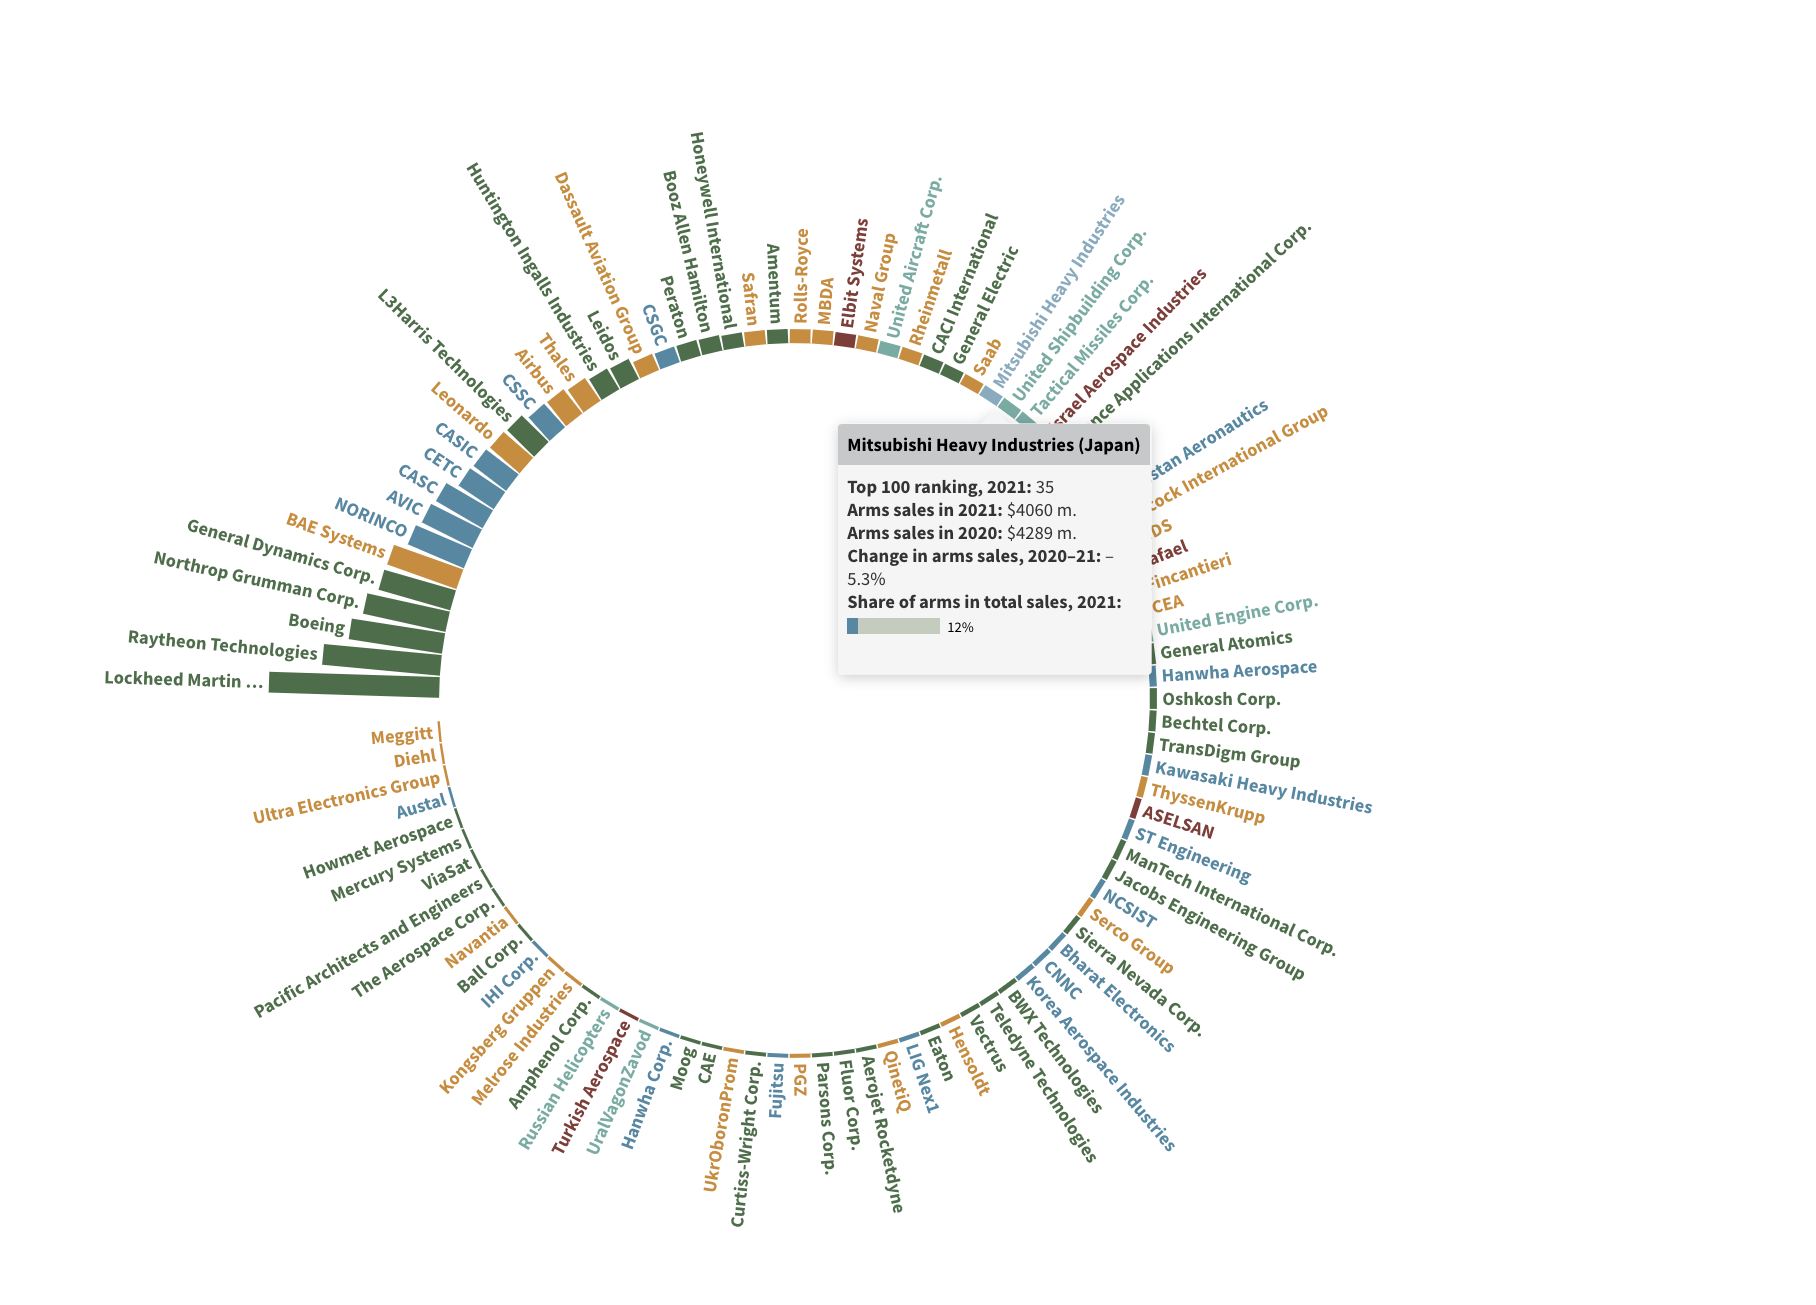
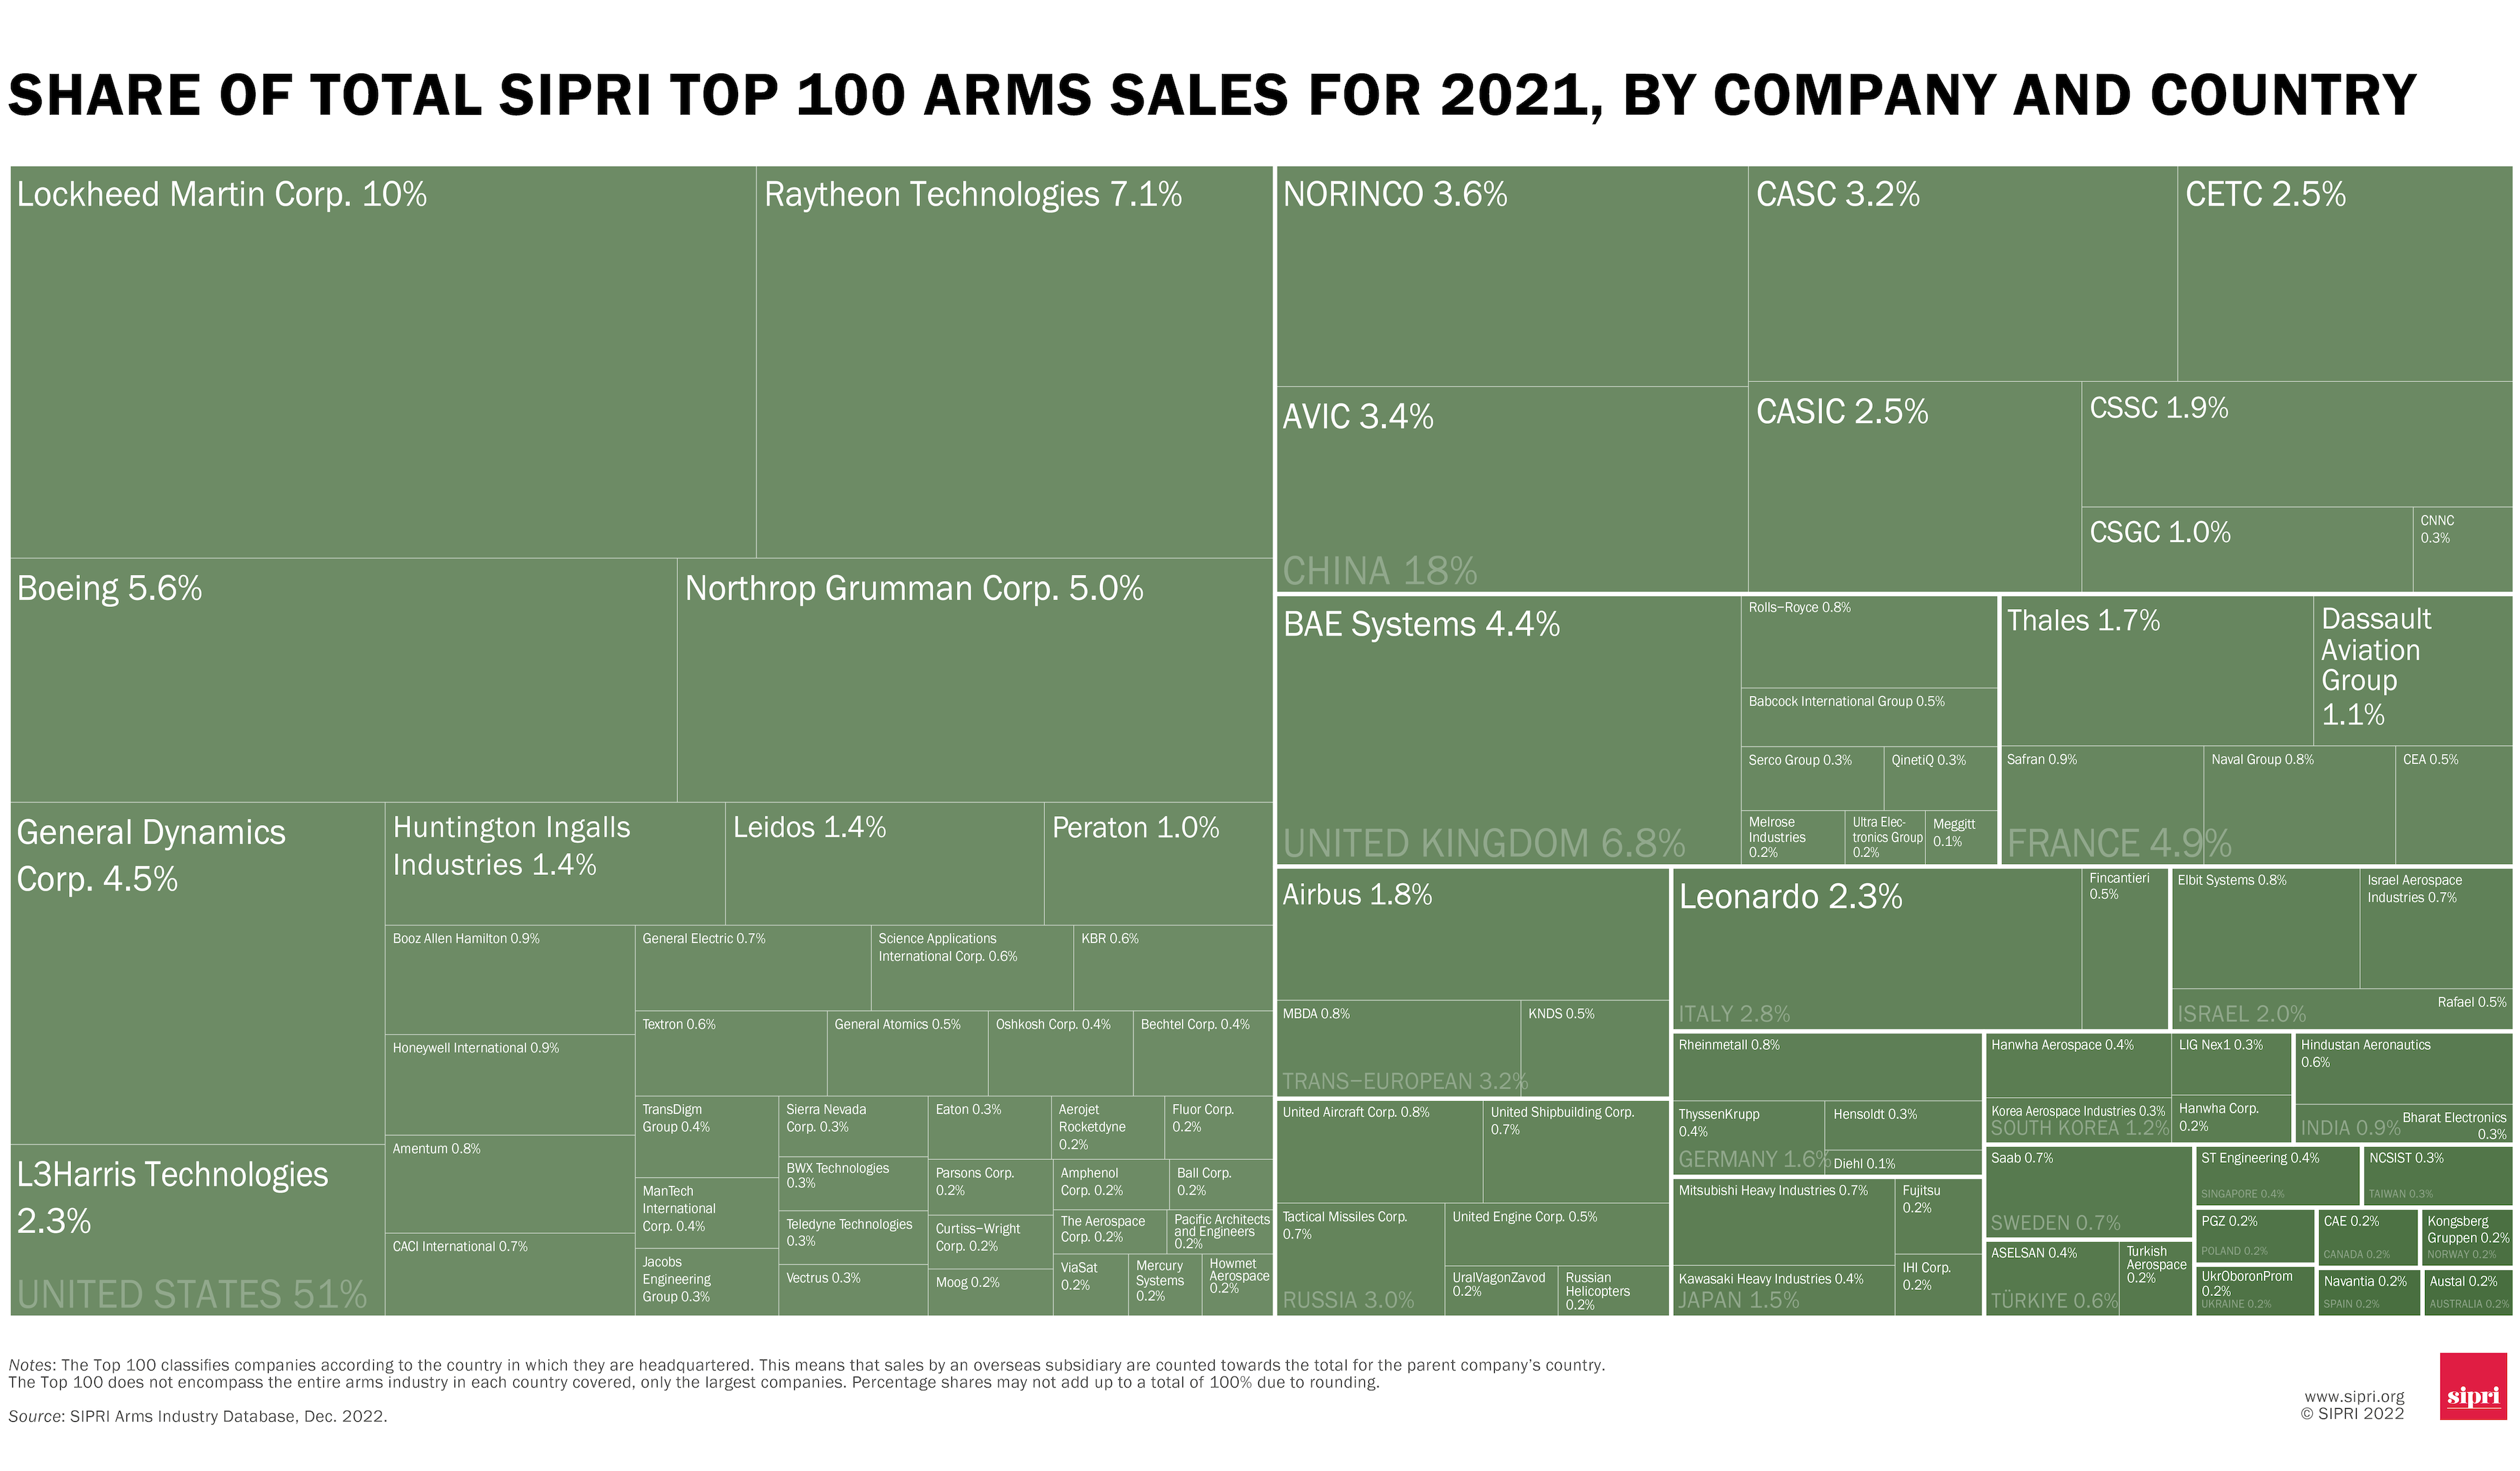
The graphic below shows what share of the total arms sales of the SIPRI Top 100 companies for 2021 individual companies accounted for. Click on the image for a full-size version.
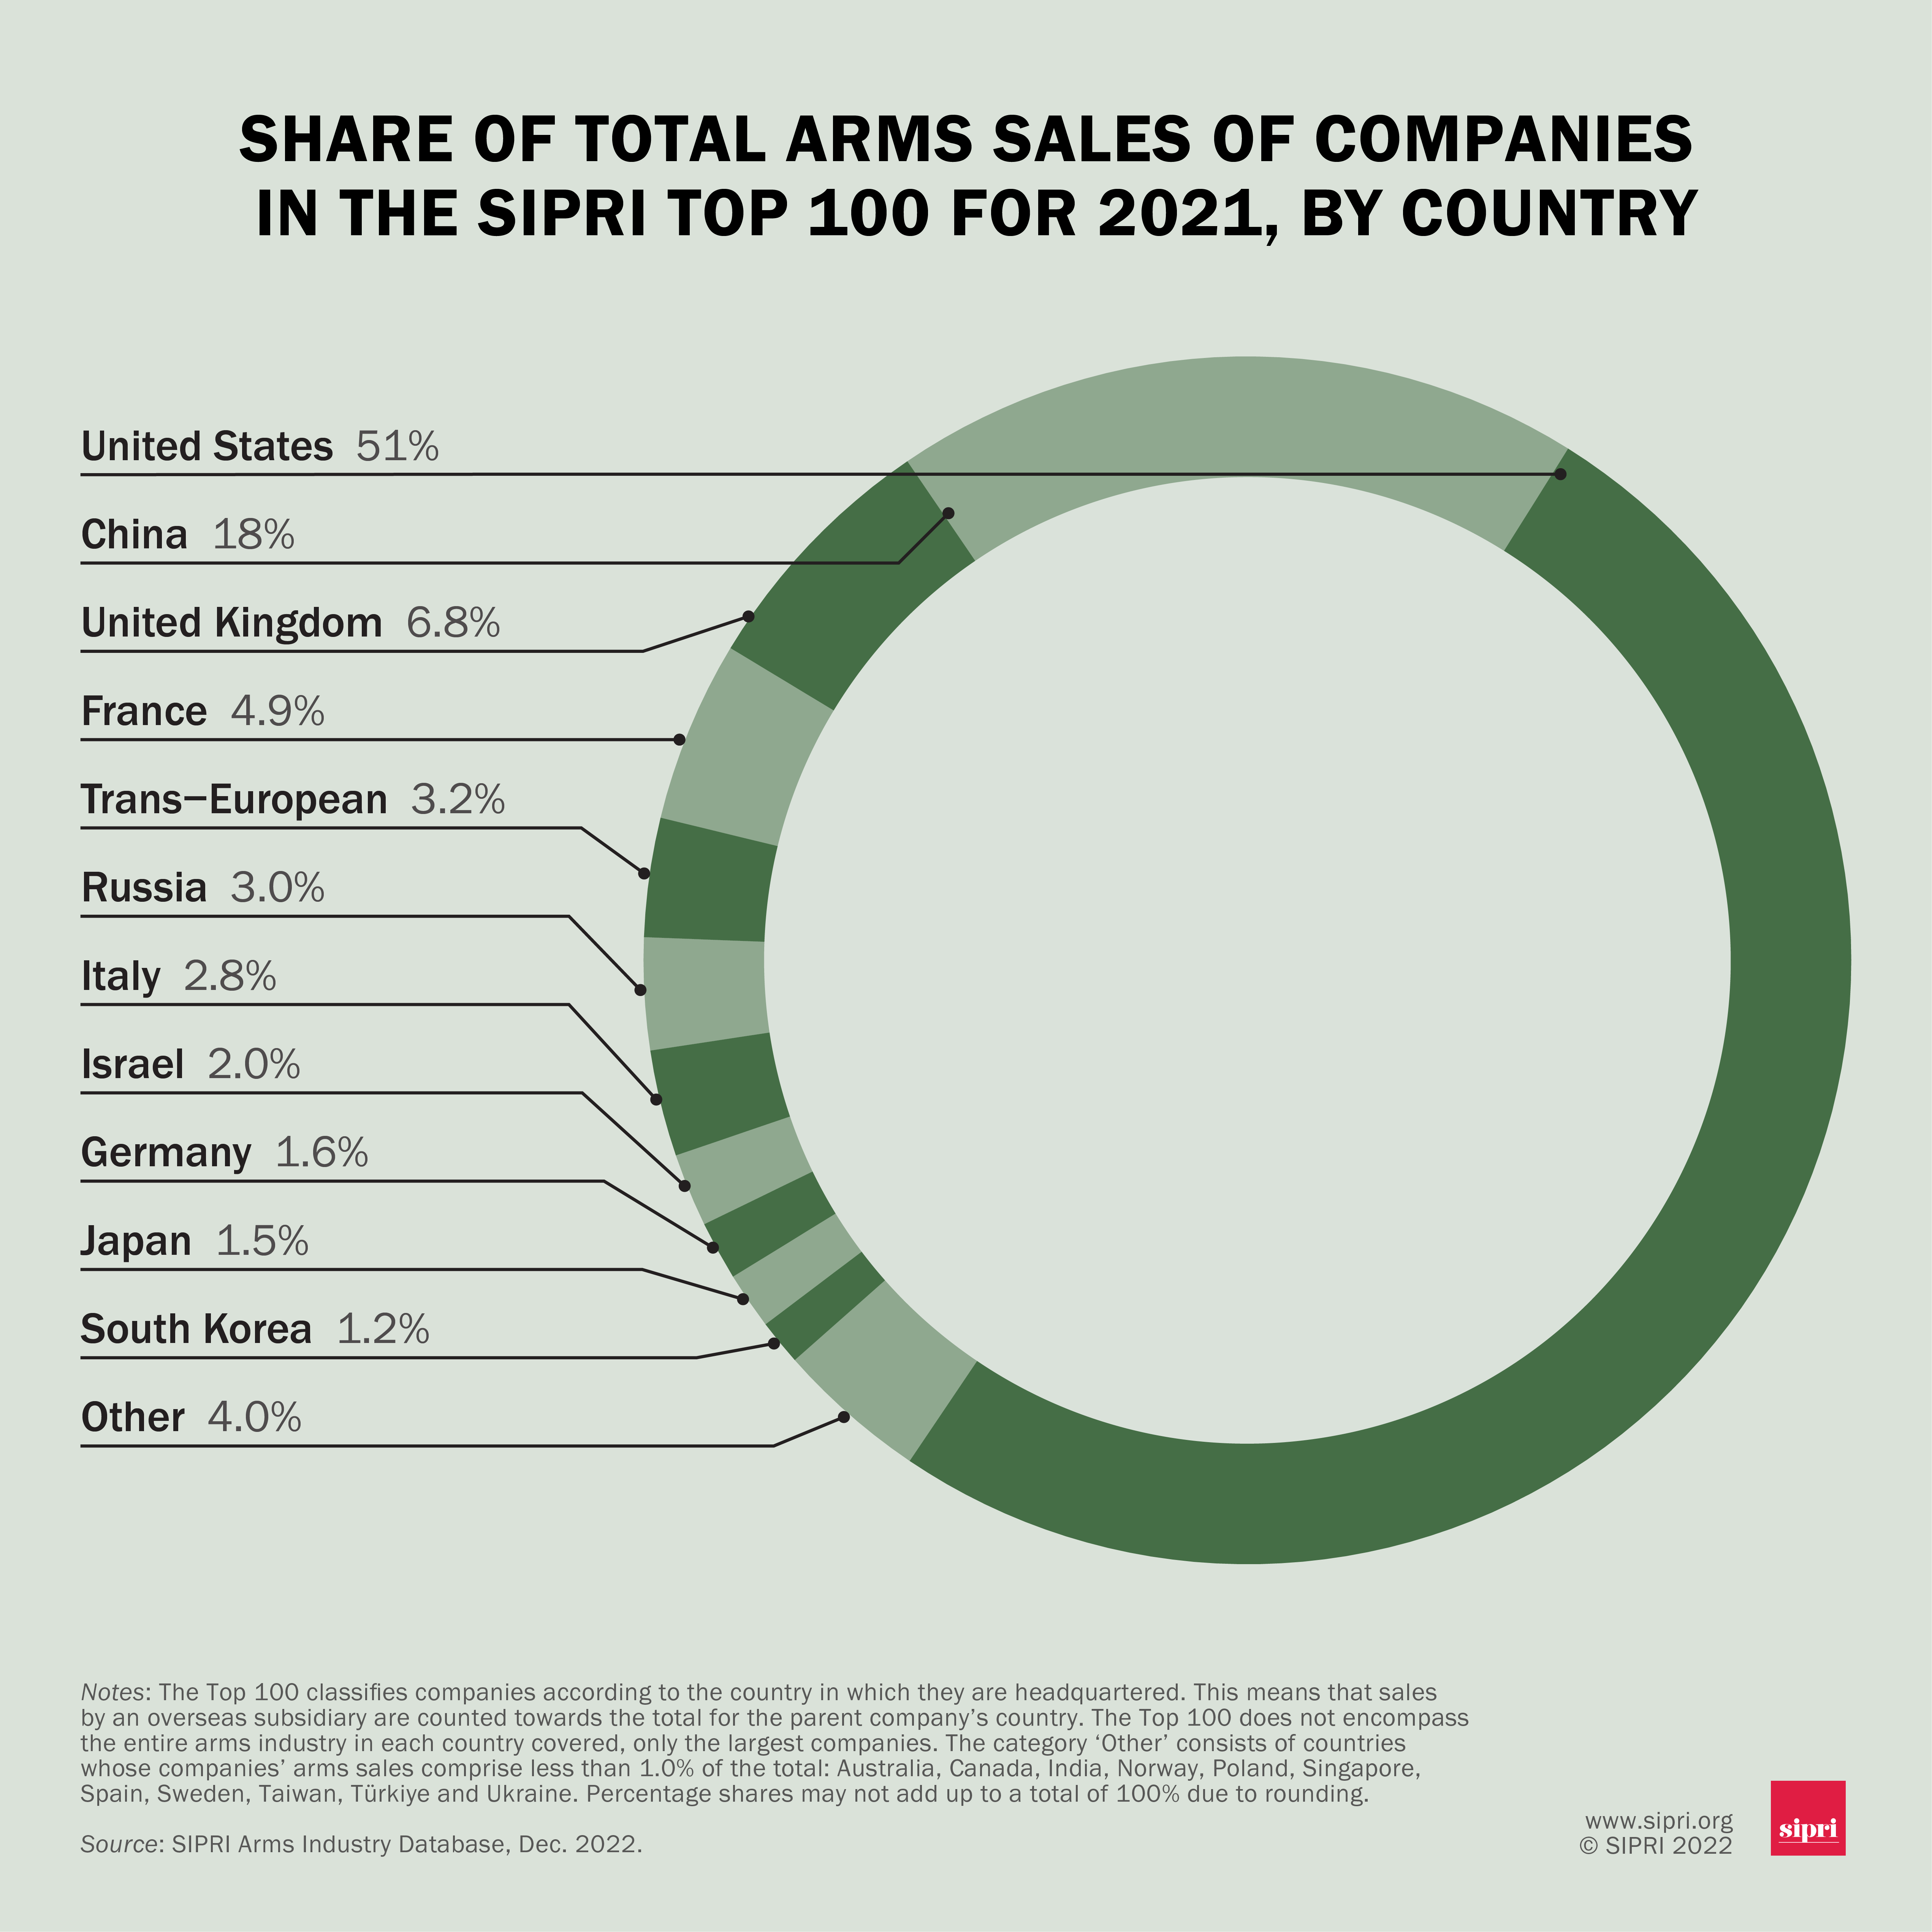
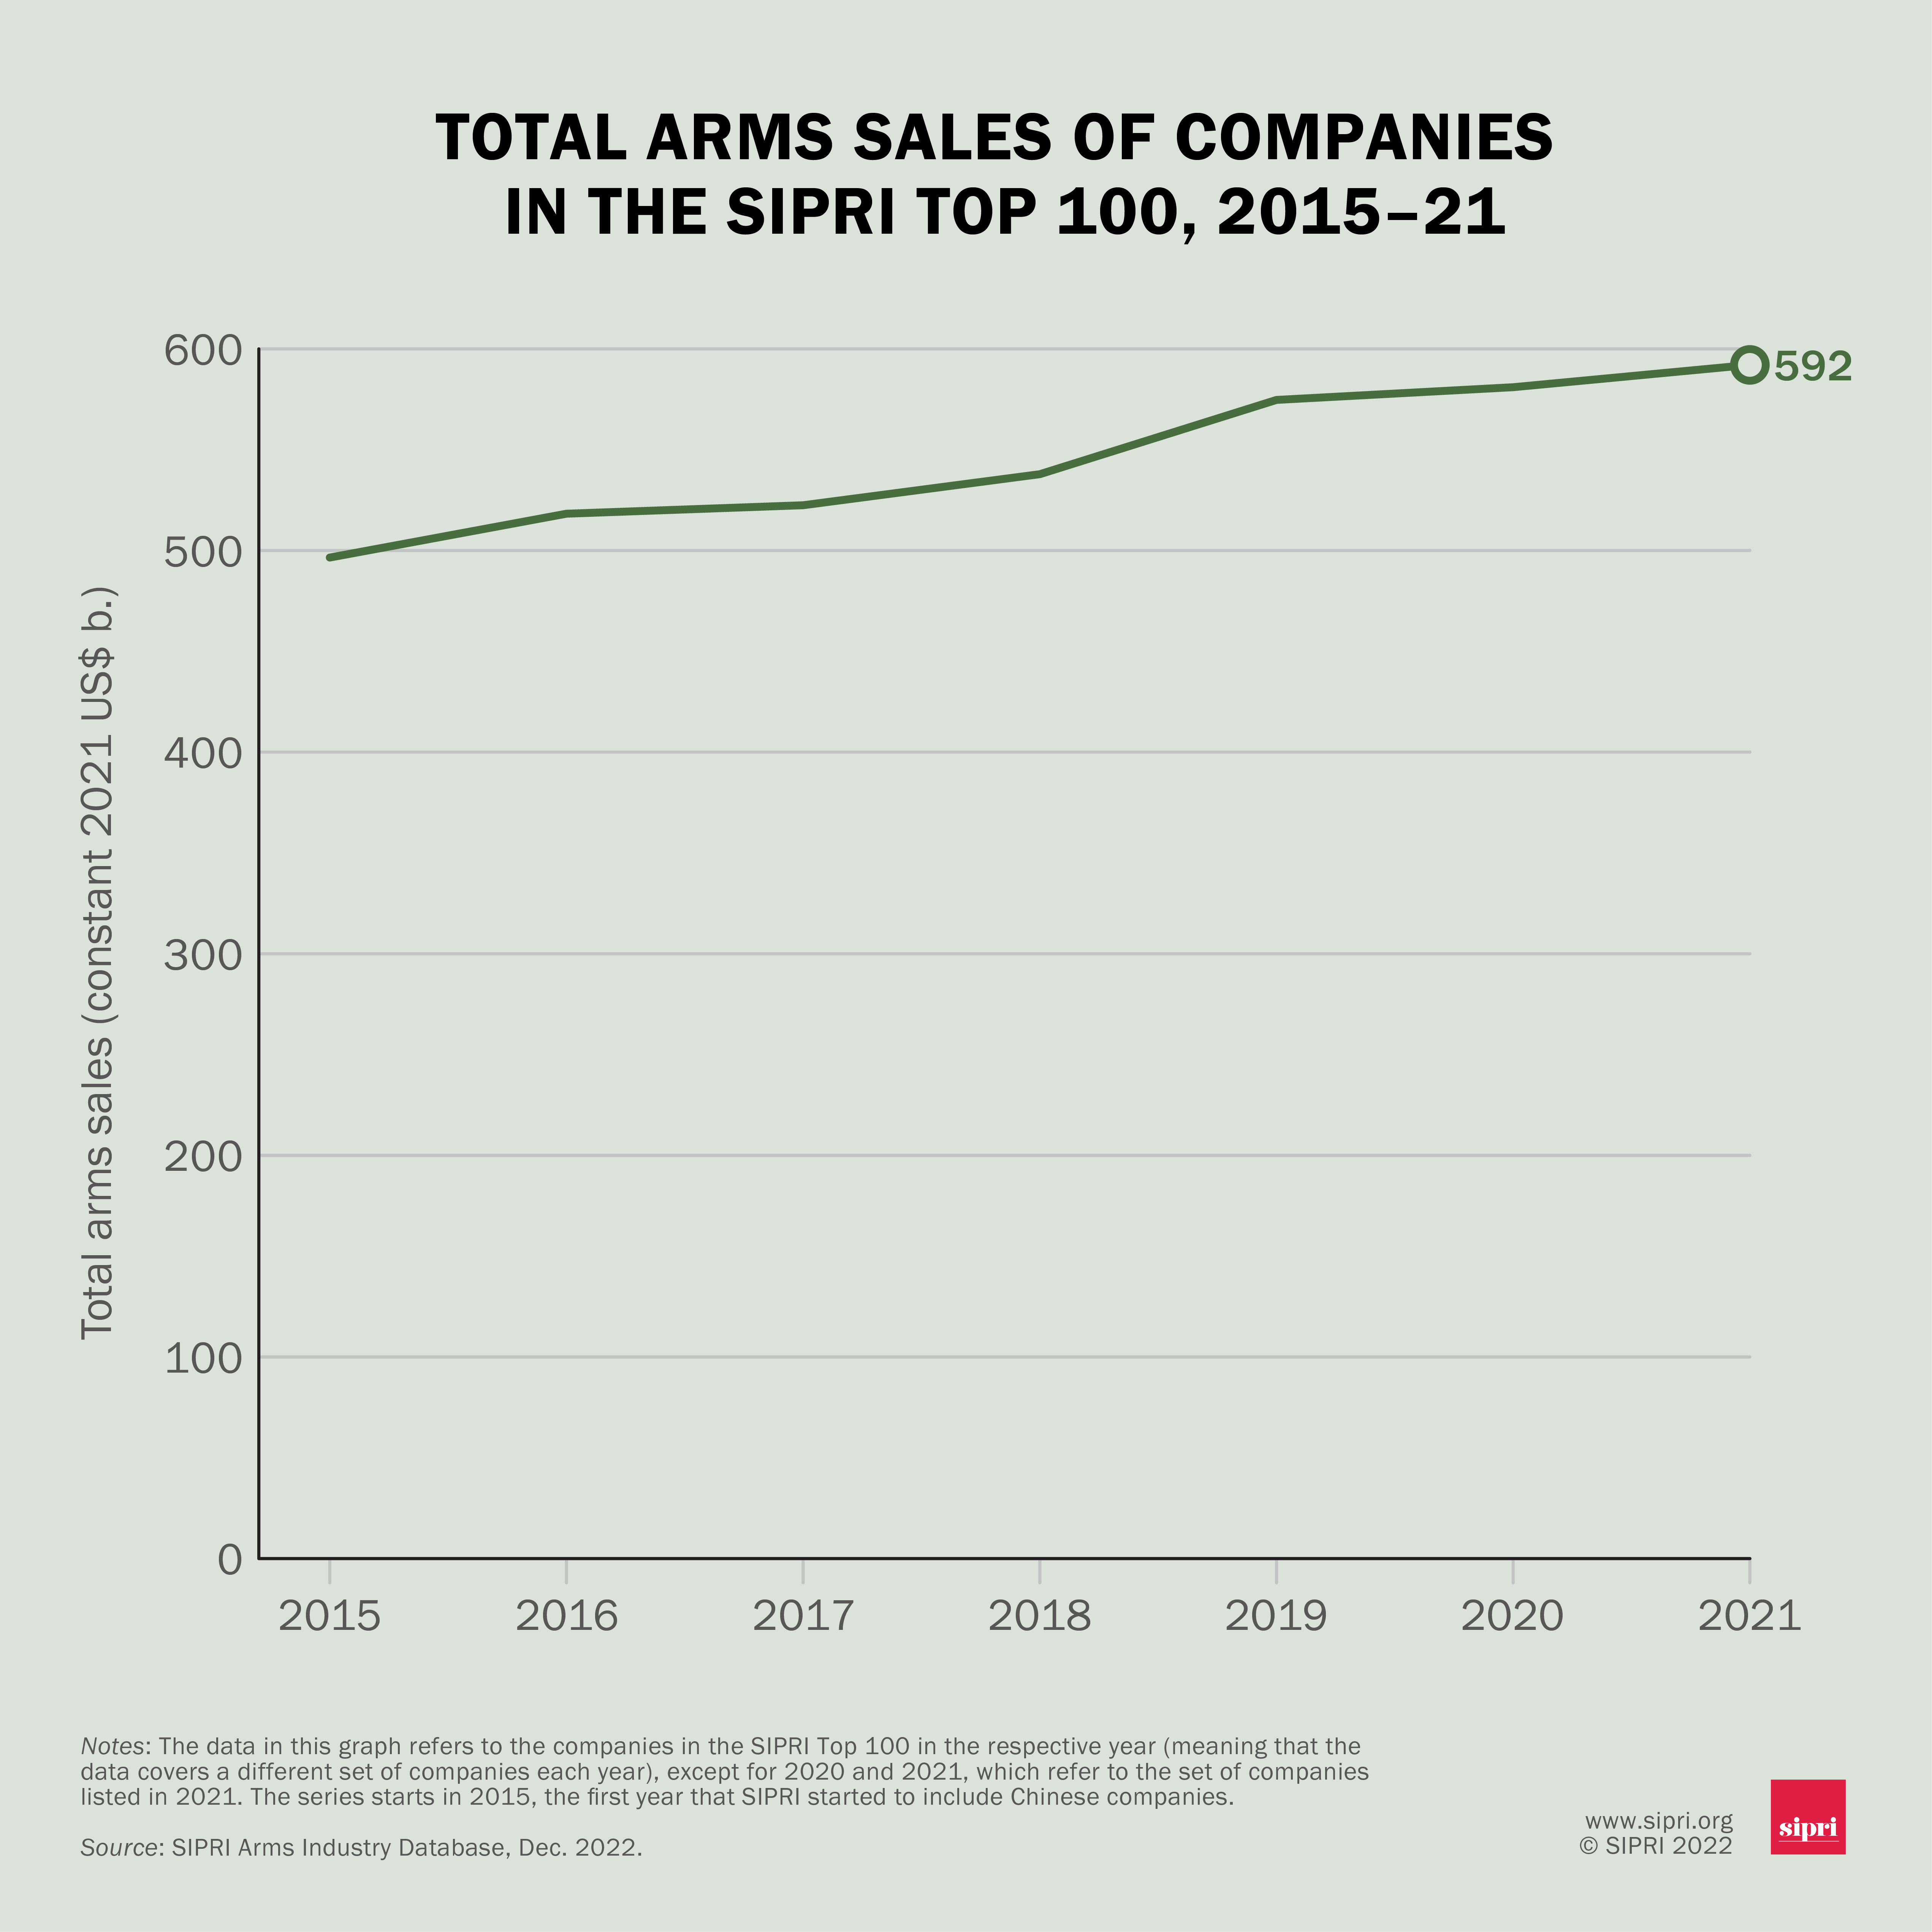
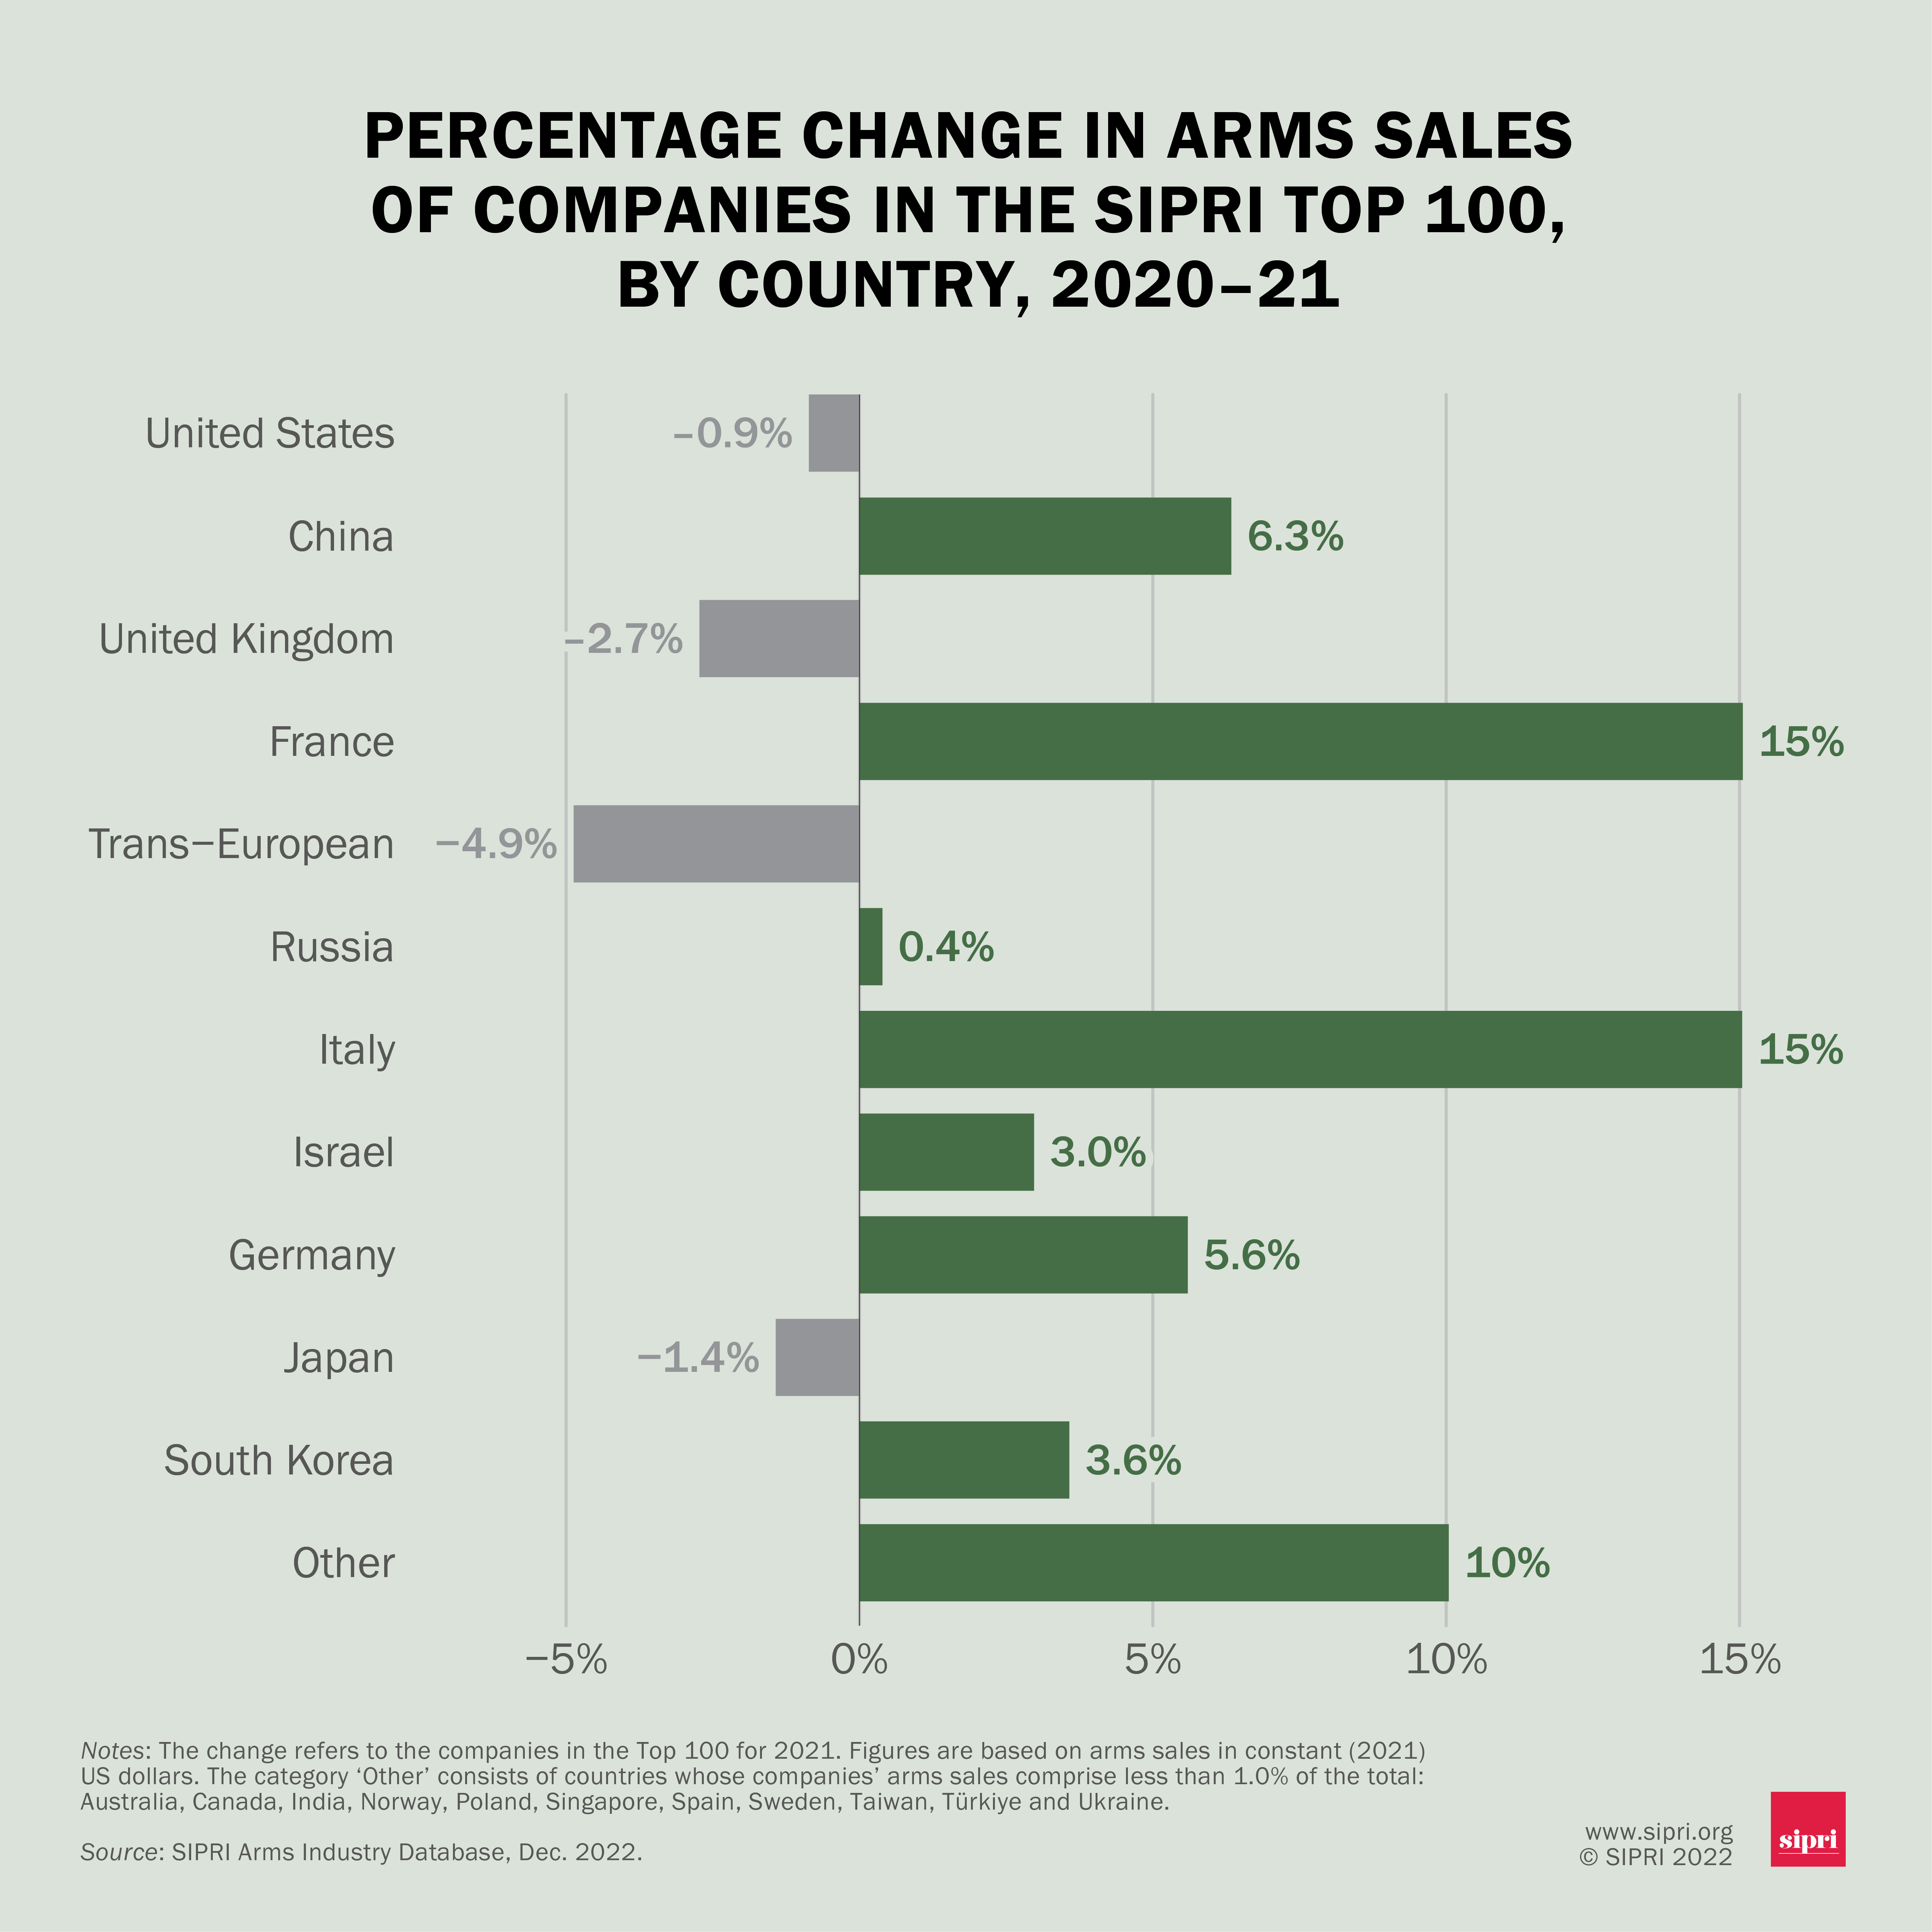
The charts below come from the SIPRI Fact Sheet The SIPRI Top 100 Arms-producing and Military Services Companies, 2021.